
What thermal imaging adds to a diabetic foot examination
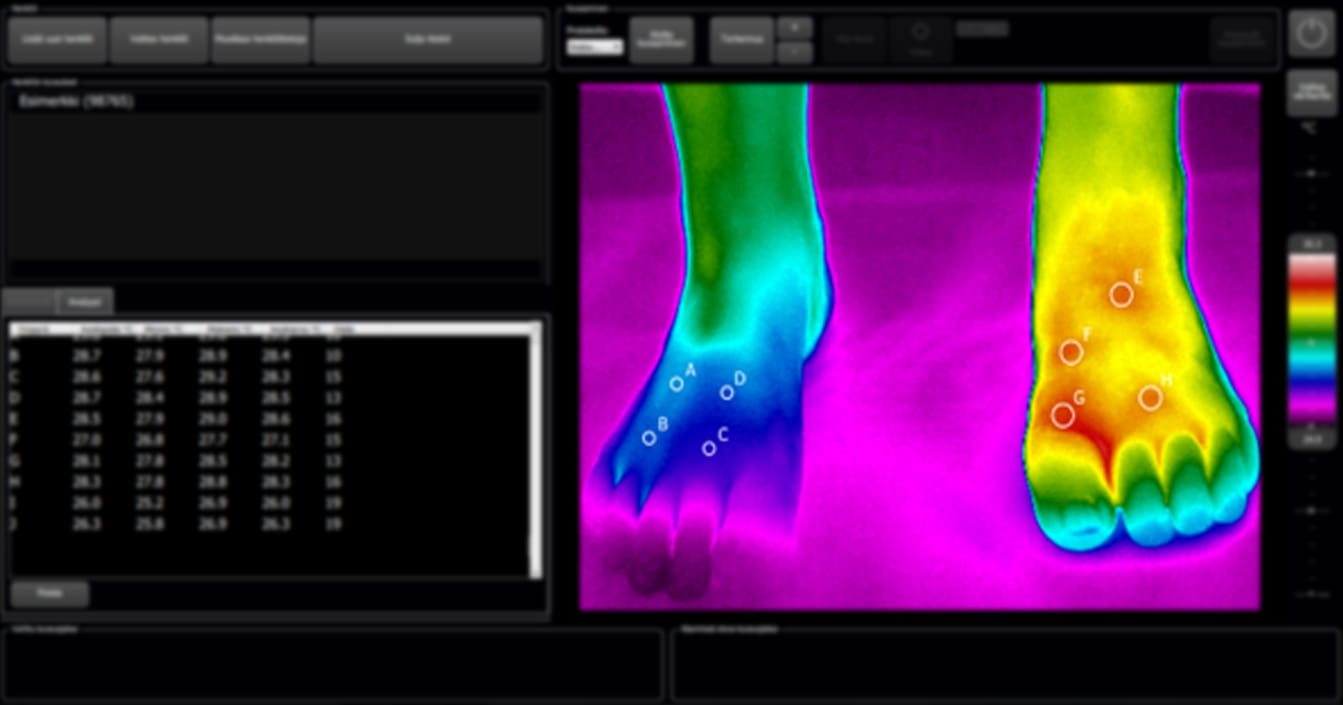
You already inspect, palpate and test sensation. A thermal scan adds one thing those cannot give you: the temperature of every point on both feet, at the same moment, as a number you can keep.
Where, not just whether
A handheld thermometer tells you a foot is warm. A thermal image tells you which part of it, and by how much, so offloading has an address instead of a general direction.
An objective number in the record
“The left forefoot looked a little red” becomes a dated measurement at a named site. The next clinician reads the same thing you saw, and so does the next shift.
You can check the treatment worked
Re-image after offloading, casting or revascularisation and see whether the difference is closing. A trend answers the question a single reading cannot.
The patient can see it too
A neuropathic patient cannot feel the problem, so being told about it rarely changes the shoe. A picture of their own foot, with the hot area in red, frequently does.
Why early diabetic foot damage goes unnoticed
Neuropathy, impaired perfusion and repetitive loading each remove a different warning the clinic would otherwise rely on. Between them they explain why so much diabetic foot damage is first noticed at the point where it is hardest to treat.
The patient cannot feel it. Neuropathy removes the pain that would prompt someone to check a shoe, unload a toe, or book an appointment. Inflammation runs its course in silence.
Perfusion and inflammation pull in opposite directions. A cool foot can mean an arterial problem while a hot spot means metabolic stress. Colour and callus tell you neither.
The damage starts under the surface. Repetitive loading breaks tissue down beneath intact skin and hard callus, so the visual exam is looking at the last thing to change, not the first.
Why temperature matters
»
Warmth is the measurable sign. Of the classical signs of inflammation, pain, redness and swelling are all judgement calls. Temperature is the one that comes back as a number.
»
Symmetry is the baseline. In normal physiology the same site on each foot reads within about a degree of its opposite number, so the other foot is the control you always have.
»
Detail a spot reading cannot resolve. A handheld infrared thermometer returns a mean over a wide area. In published image analysis, whole-foot thermography resolved inflamed areas as small as 2 mm across.
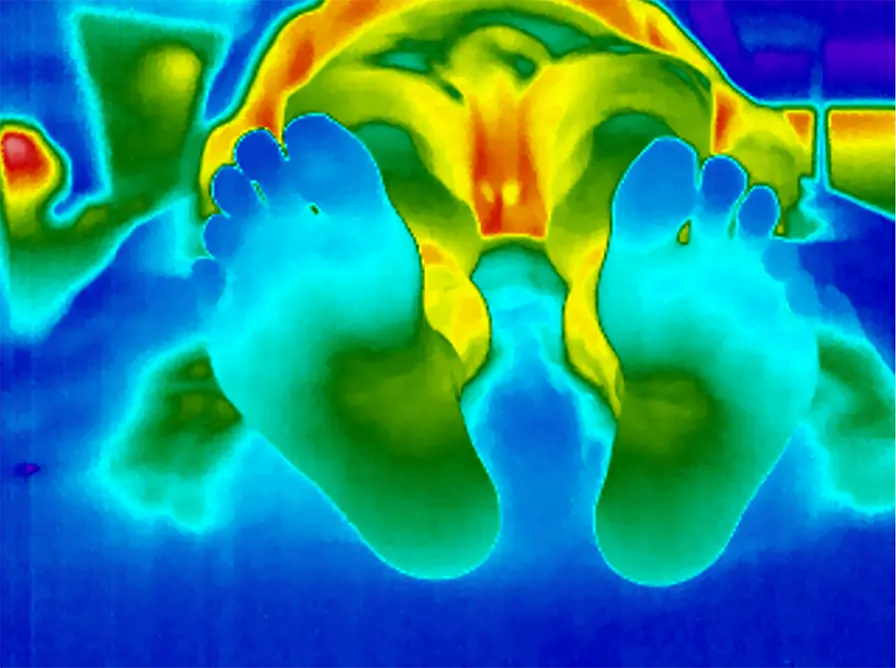
Bharara et al., Diabetes Metab Res Rev (2012); Rathod et al. (2015); Kaabouch et al., J Biomed Opt (2010).
What the research shows about foot temperature monitoring
Skin temperature as an early warning for the diabetic foot has been tested in randomised trials, in home monitoring, in Charcot assessment and in a national cost model. It also sits in the international prevention guideline. The studies below are why a thermal reading changes what a clinic does next.
2.2 °C
between matching sites on the two feet, on two consecutive days. That is the action threshold used in the monitoring trials and named in the international prevention guideline: reduce activity, and get the foot looked at.
Lavery et al., Diabetes Care, 2007 · IWGDF prevention guideline, 2023 update
Fewer ulcers in a randomised trial
173 high-risk patients, 15 months. Those who measured foot temperature daily and acted on a 2.2 °C asymmetry ulcerated at 8.5%, against 29.3% on standard care.
Weeks of warning, not days
Daily monitoring in 129 patients flagged 97% of the plantar ulcers that followed, an average of 37 days ahead, at the cost of a 57% false-positive rate at that threshold.
Reliable enough for Charcot
In 32 patients with Charcot neuroarthropathy, infrared dermal thermometry gave good to excellent agreement between and within raters, best without contact. A reliability finding, not a diagnostic one.
It is in the prevention guideline
The IWGDF advises considering daily foot temperature self-monitoring for patients at moderate or high risk, acting above 2.2 °C on two consecutive days. A conditional recommendation, moderate certainty.
Convinced by the studies, unsure about your clinic?
Tell us how your foot screening runs today and we will say plainly where a thermal reading would change a decision, and where it would not.
Diabetic foot thermal imaging in practice
Charcot suspicion, weight stress before blistering, and arterial disease with documented pressures. Three patterns a diabetic foot clinic sees every week, and what the image added in each.

Case 01 · Charcot neuroarthropathy
A misdiagnosis risk that shows up as heat first
Early Charcot is difficult to diagnose and frequently mistaken for infection, gout or a sprain. The acute foot is inflamed, and that inflammation is thermally loud long before radiographs are conclusive.
In the second image the maximum difference between the feet reached 8 °C. Serial imaging then tracks whether offloading is bringing that difference down.
Thermometry is a reliable way to measure skin temperature in Charcot patients. Confirmation stays clinical and radiological.
Case 02 · Blisters and poor circulation
Where the load is, before the blister forms
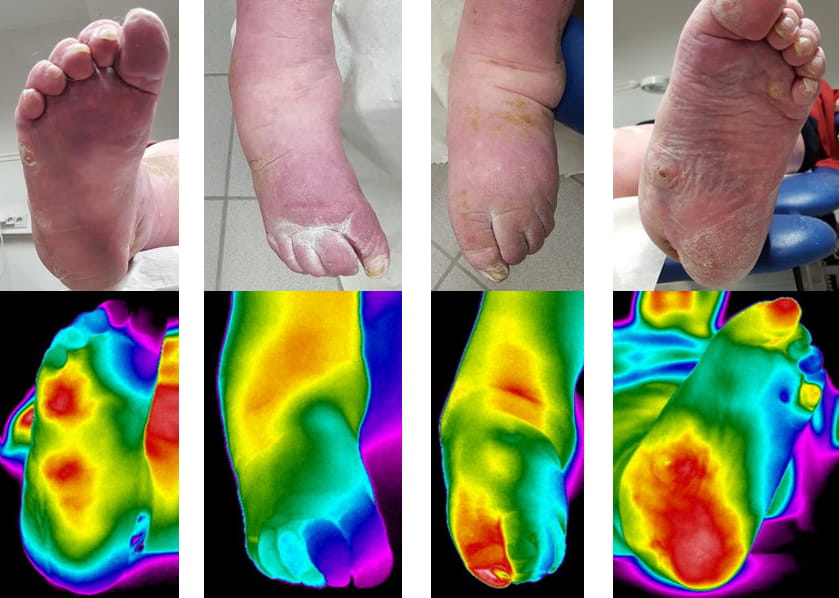
The photographs show the feet as the clinic sees them. The thermal frames locate the problem areas: high-temperature regions under weight stress, with the potential for skin breakdown, alongside cooler poorly perfused zones.
Two questions get answered in one capture: where pressure is concentrating, and whether the blood supply can support healing there.
Offloading is aimed at a located hotspot, then re-imaged to confirm the load actually moved.

Case 03 · Peripheral arterial disease
A perfusion map next to the pressure indices
A revascularised patient with documented disease on both sides. The vascular numbers describe the supply. The thermal images show how that supply is distributed across the tissue that has to heal.
Offloading is aimed at a located hotspot, then re-imaged to confirm the load actually moved.
Published, with our own device
When MRI wasn't enough for a correct diagnosis
A 67-year-old woman with type 1 diabetes and a history of Charcot neuroarthropathy presented with a hot foot. Recurrence was suspected after an MRI scan, and a handheld thermometer confirmed the foot was warm.
Whole-foot imaging on a Thermidas ThIR-A615 located it: a 7 °C rise and the heat clearly radiating from the wound site. The team agreed that the temperature distribution was consistent with osteomyelitis and not a new case of Charcot.
Plain radiography separates Charcot from osteomyelitis in only 50–60% of cases, and initial MRI reporting in this area carries a documented misdiagnosis rate close to 30%. That is the gap the image was asked to close.
Harkin G. Imaging in osteomyelitis and Charcot neuroarthropathy: can infrared thermography aid in diagnosis? The Diabetic Foot Journal, 2023;26(1):24–28. NHS Greater Glasgow & Clyde. A single published case, not a trial.
How thermal imaging fits your diabetic foot screening workflow
The patient is already shoeless and the notes are already open. After training, nurses, podiatrists and medical assistants capture the images in minutes.
When to scan
Routine diabetic foot examination
Follow-up of high-risk patients
Monitoring suspected Charcot foot
Wound clinic visits
Checking whether offloading worked
What the image helps decide
Which area needs offloading or pressure redistribution
Whether further imaging or a specialist referral is warranted
Whether inflammation is resolving or progressing
What to show the patient, which is often what changes behaviour
What ends up in the record
Dated thermal images of both feet, and the sites you measured
The exact temperature readings that are easy to compare
A comparison against that patient's own earlier scans
An export the next clinician, the GP or the ward can read
“Feet temperature variation in neuropathic patients is a predictive element of the ulcer appearance, so infrared thermography, due to its characteristics and easy use, is a good tool to detect this temperature difference.”
Faus Camarena M et al. Update on the Use of Infrared Thermography in the Early Detection of Diabetic Foot Complications: A Bibliographic Review. Sensors, 2024;24(1):252. A review of 26 studies published since 2013.
What earlier detection is worth
Foot complications are among the most expensive parts of diabetes care and among the most preventable, which is an unusual combination. It is also the argument that gets a device through a budget meeting.
Armstrong et al., N Engl J Med (2017) and JAMA (2023) · Armstrong et al., J Foot Ankle Res (2020) · McDermott et al., Diabetes Care (2023) · Bus & van Netten, Diabetes Metab Res Rev (2016) · Rice et al., Diabetes Care (2014), incremental cost over diabetes care, 2007–11 claims data · Kerr et al., Diabet Med (2019), NHS England, financial year 2014–15 · Kurkela et al., ClinicoEcon Outcomes Res (2023) · International Diabetes Federation, IDF Diabetes Atlas, 11th edition (2025), reporting 2024 estimates. Reported five-year mortality after ulceration ranges from about 30% to 49% depending on the cohort; the lower figure is used here. Prevention figures describe populations under structured foot care, not the effect of any single device.
Recommended solution
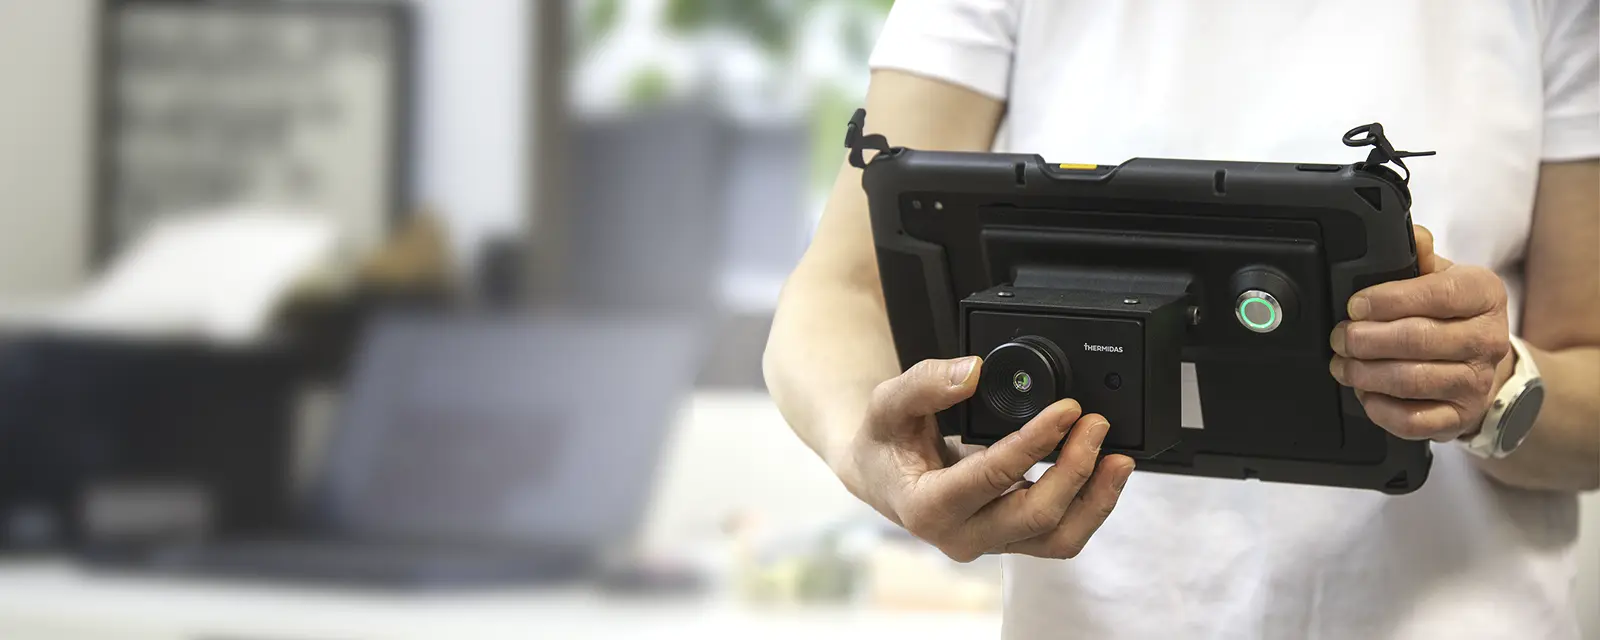
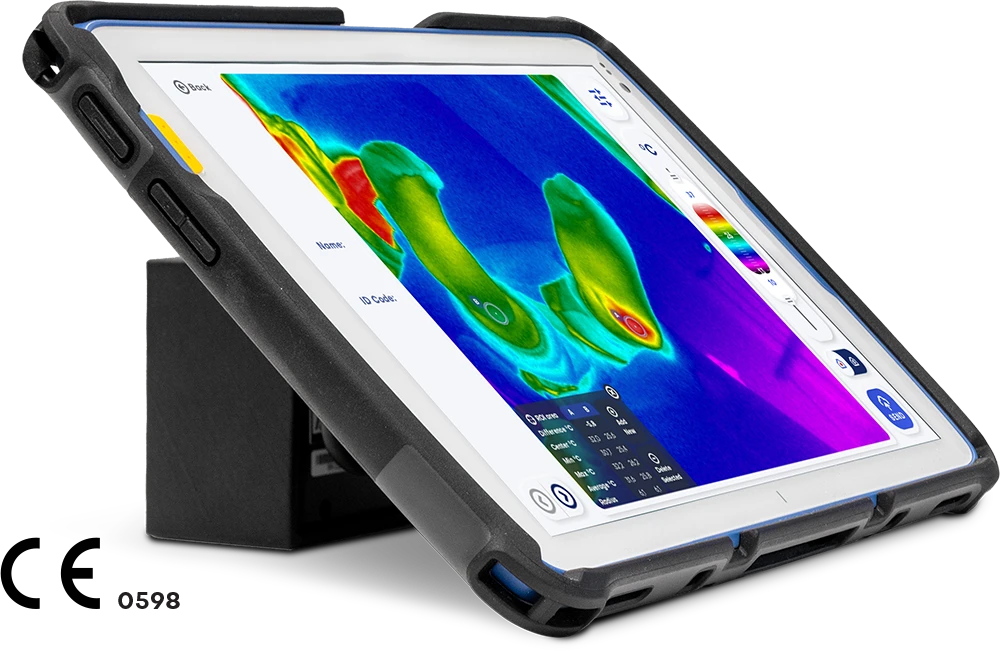
Thermidas IRT-384 Tablet
The IRT-384 Tablet is a high-quality thermal imaging solution for locating problem areas and monitoring the effectiveness of treatment.
Thermal imaging also supports the client’s understanding of rehabilitation progress by providing clear, objective information on the effects of treatment.
Preventive care starts here
We are here to help you. Let us know whether you have any questions, want to see an online demo first, or prefer to start thermal imaging with a trial.
You can also email or call us:
info@thermidas.fi
+358 20 794 0961
